Showing posts with label Tuning. Show all posts

Monday, April 2, 2012

Book Review - High Performance MySQL 3rd Edition

Add to Technorati Favorites Ver este articulo en Español

This is THE MySQL performance book. Period!
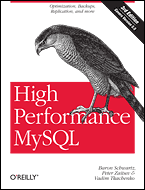


Every chapter is very well crafted, with a precise balance between theory and practice, and full of invaluable nuggets, sometimes transcending the MySQL arena and applicable to any database! Such cases are Chapter 2-Benchmarking MySQL and Chapter 3-Profiling Server Performance, very solid foundations for the reading ahead.

All over the text, authors propose tools, examples of use and proven diagnostic techniques, that will greatly improve your performance firefighter skills and enhance your knowledge of MySQL internals. Nevertheless, what I liked the most from this book is taking into consideration the physical part of database structures in play when speaking about performance, which is something most authors don't include; plus treatment on MySQL high availability and cloud features, which we'll increasingly see on customers.

As you may know, MySQL architecture relies on what is called “Storage Engines” and this book provides resolution down to that level, describing behavior, pros and cons among each major storage engine, plus some improvements coming for MySQL 5.6 (now in beta stage). That is cool!!!

However, there is something that kind of bugged me at times and was references to a specific commercial MySQL offering and tools, but after taking a look to that company web-site, found that is a great contributor to the MySQL community and you can actually use the tools!

At the O'Reilly website you can take a look to the book's TOC, bet you will find it very complete; hey! you can even peek the content with Google Preview, just follow the link: High Performance MySQL

If you are interested on Mathematical Rigorous methods for performance tuning see Performance Enlightening - The Craig Effect (Tropa de Elite)

 Subscribe to Oracle Database Disected by Email Follow IgnacioRuizMX on Twitter Delicious Bookmark this on Delicious

Thursday, March 29, 2012

Performance Enlightening - Craig Effect (Tropa de Elite)

Add to Technorati Favorites Ver este articulo en Español
 
During the past week I had the opportunity to assist both the Oracle Performance Firefighting and the 
Advanced Oracle Performance Analysis and only can say: awesome!!!
 
Craig Shallahamer is a great teacher and has a lot of resources to effectively share knowledge, even if 
the subject is complex like buffer cache structures or arid like the mathematical foundation required for 
perf analysis. That is not all, he provides valuable tips of the trade or anecdote nuggets, dipped on a 
very fresh and sometimes humorist perspective.
 
The result: we started searching for those AWRs and Statspack reports that were difficult to analyze, I even 
recalled some unsolved performance cases that stained my record; difference now, is we all have the 
analytical elements to properly handle these and new challenges.
 
Here a group picture of "The Elite Squad" (Tropa de Élite)
Tropa de Élite
Sao Paulo, Brazil / March 19th-23th 2012
 If you want to know more about these trainings or get more insight on Craig's methodologies and research, please click 
the image below (a new window will show up, you may need to allow this pop-up).
 
 
Subscribe to Oracle Database Disected by Email Follow IgnacioRuizMX on Twitter Delicious Bookmark this on Delicious

Monday, October 20, 2008

Statspack snapshot levels

Add to Technorati Favorites

You're going to start taking snapshots for Statspack reports, however do you really know what level will give you the detail you want? Valid values for snapshot level are 0,5,6,7 and 10, ordered from the less detailed to the most detailed.

Following are listed all the sections that may appear on a Statspack report and the snapshot level you need to run in order to get data for them. They are listed as their appearance order within the Statspack report. An 'X' mark means "present".

Snapshot Level

0 5 6 7 10
STATSPACK report for x x x x x
Load Profile x x x x x
Instance Efficiency Percentages
x x x x x
Top 5 Timed Events x x x x x
Wait Events for DB x x x x x
Background Wait Events for DB x x x x x
SQL ordered by Gets for DB
x x x x
SQL ordered by Reads for DB
x x x x
SQL ordered by Executions for DB
x x x x
SQL ordered by Parse Calls for DB
x x x x
SQL ordered by Sharable Memory for DB
x x x x
Instance Activity Stats for DB x x x x x
Tablespace IO Stats for DB x x x x x
File IO Stats for DB x x x x x
Buffer Pool Statistics for DB x x x x x
Instance Recovery Stats for DB x x x x x
Buffer Pool Advisory for DB x x x x x
Buffer wait Statistics for DB


x x
PGA Aggr Target Stats for DB x x x x x
PGA Aggr Target Histogram for DB x x x x x
PGA Memory Advisory for DB x x x x x
Enqueue activity for DB


x
Rollback Segment Stats for DB x x x x x
Rollback Segment Storage for DB x x x x x
Undo Segment Summary for DB
x x x x
Undo Segment Stats for DB
x x x x
Latch Activity for DB x x x x x
Latch Sleep breakdown for DB x x x x x
Latch Miss Sources for DB x x x x x
Parent Latch Statistics DB


x
Child Latch Statistics DB


x
Top 5 Logical Reads per Segment for DB


x x
Top 5 Physical Reads per Segment for DB


x x
Top 5 Buf. Busy Waits per Segment for DB


x x
Top 5 Row Lock Waits per Segment for DB


x
Top 5 ITL Waits per Segment for DB


x
Dictionary Cache Stats for DB x x x x x
Library Cache Activity for DB x x x x x
Shared Pool Advisory for DB x x x x x
SGA Memory Summary for DB x x x x x
SGA breakdown difference for DB x x x x x
Resource Limit Stats for DB x x x x x
init.ora Parameters for DB x x x x x

Now that you have decided which level are you going to use, you may read this article 2 minute guide to Statspack sampling, to start taking snaphots for your reports.

In case you want to know how to install Statspack quickly, read this 2 minute guide to Statspack installation.

Subscribe to Oracle Database Disected by Email

Follow IgnacioRuizMX on Twitter

Sunday, May 25, 2008

2 minute guide for Statspack sample scheduling

Now that you have installed the Statspack tool, you need to start taking samples or snapshots. This is a task you may easily automate, and is recommended to do so, because snapshots are evenly and uniformly spaced.

You may schedule this task using cron, at or any OS or 3rd party scheduler, but I would suggest a better way: database jobs.

Advantages:
-Database Contained
-Don't breach security exposing users/passwords

The Statspack set of tools provides a script that automatically creates the job for you: spauto.sql. It's located at $ORACLE_HOME/rdbms/admin and you may easily customize the NEXT_DATE parameter for dbms_job.submit (below, red color) and adjust the time interval . You will need to change TRUNC rounding precision if you go from hours to minutes.


dbms_job.submit(:jobno, 'statspack.snap;', trunc(sysdate+1/48,'MI'), 'trunc(SYSDATE+1/48,''MI'')', TRUE, :instno);


Then you need to run the spauto script as the user perfstat or the Statspack owner you have:


SQL> conn perfstat
Password:

Connect
SQL> @?/rdbms/admin/spauto


You will get an output like this, showing the job number created by spauto and information regarding the next execution time. At this point, snapshot taking has been scheduled succesfuly.


Job number for automated statistics collection for this instance
~~~~~~~~~~~~~~~~~~~~~~~~~~~~~~~~~~~~~~~~~~~~~~~~~~~~~~~~~~~~~~~~
Note that this job number is needed when modifying or removing
the job:


JOBNO
----------
23


Job queue process
~~~~~~~~~~~~~~~~~
Below is the current setting of the job_queue_processes init.ora
parameter - the value for this parameter must be greater
than 0 to use automatic statistics gathering:

NAME TYPE VALUE
------------------------------------ ----------- ------------------------------
job_queue_processes integer 10


Next scheduled run
~~~~~~~~~~~~~~~~~~
The next scheduled run for this job is:


JOB NEXT_DATE NEXT_SEC
---------- --------- --------
23 23-MAY-08 17:52:00


How to stop taking snapshots

After you finish taking samples or if you ran out of space for the Statspack tablespace, you'll need to stop the snapshot job. This is very easy, as you may see next:


SQL> conn perfstat -- the Statspack owner
Password:

Connected
SQL> select job, what from user_jobs;

JOB WHAT
---------- ------------------------
2
23 statspack.snap(10);

SQL> exec rdbms_job.remove(23);

PL/SQL procedure successfully completed.

SQL> select job, what from user_jobs;

JOB WHAT
---------- ------------------------
2


I hope this tip is useful for you, as it has been very helpful for me.

Please leave your comments, your feedback is vital to improve this content

Add to Technorati Favorites

Subscribe to Oracle Database Disected by Email

Friday, March 28, 2008

Sure...your trash will drag you!!!

If you have figured out what happened, you may be wondering why Oracle implemented the free space view in that way, don't you?

In case you are lost in the darkness follow the next real-life case:

Connected to:
Oracle Database 10g Enterprise Edition Release 10.2.0.1.0 - 64bit Production
With the Partitioning, OLAP and Data Mining options

SQL> select count(*) from dba_free_space;

COUNT(*)
----------
193822
_
SQL> select count(*) from all_objects where object_name like '%BIN%';

COUNT(*)
----------
175249

SQL> set timing on
SQL> run
1 select count(*) from all_objects where object_name like '%BIN%'
2*

COUNT(*)
----------
175249

Elapsed: 00:00:27.00
SQL> select count(*) from dba_free_space;

COUNT(*)
----------
193821

Elapsed: 00:00:45.71


That is a long waiting time for a free space report, don't you think? ... I'm not a lazy and careless DBA, but you can't take my word for granted, therefore I will check if statistics are more-or-less accurate and later refresh them, anyway.

SQL> select num_rows, blocks from all_Tables where table_name = 'RECYCLEBIN$';

NUM_ROWS BLOCKS
---------- ----------
185640 2308

Elapsed: 00:00:00.05
SQL> exec dbms_stats.gather_table_stats(ownname=> 'SYS',
2: tabname=> 'RECYCLEBIN$', partname=> NULL);

PL/SQL procedure successfully completed.

Elapsed: 00:00:06.70
SQL> select count(*) from dba_free_space;

COUNT(*)
----------
193820

Elapsed: 00:00:46.02
SQL> run
1* select count(*) from dba_free_space

COUNT(*)
----------
193787

Elapsed: 00:00:45.82
SQL> set autotrace on explain statistics
SQL> run
1* select count(*) from dba_free_space

COUNT(*)
----------
193787

Elapsed: 00:00:46.20

Execution Plan
----------------------------------------------------------

------------------------------------------------------------------------------------------------
| Id | Operation | Name | Rows | Bytes |TempSpc| Cost (%CPU)|
------------------------------------------------------------------------------------------------
| 0 | SELECT STATEMENT | | 1 | | | 1563 (53)|
| 1 | SORT AGGREGATE | | 1 | | | |
| 2 | VIEW | DBA_FREE_SPACE | 190 | | | 1563 (53)|
| 3 | UNION-ALL | | | | | |
| 4 | NESTED LOOPS | | 1 | 39 | | 4 (0)|
| 5 | NESTED LOOPS | | 1 | 32 | | 3 (0)|
| 6 | TABLE ACCESS FULL | FET$ | 1 | 26 | | 3 (0)|
| 7 | INDEX UNIQUE SCAN | I_FILE2 | 1 | 6 | | 0 (0)|
| 8 | TABLE ACCESS CLUSTER | TS$ | 1 | 7 | | 1 (0)|
| 9 | NESTED LOOPS | | 90 | 4050 | | 12 (9)|
| 10 | NESTED LOOPS | | 90 | 3510 | | 12 (9)|
| 11 | TABLE ACCESS FULL | TS$ | 36 | 468 | | 11 (0)|
| 12 | FIXED TABLE FIXED INDEX | X$KTFBFE (ind:1) | 3 | 78 | | 0 (0)|
| 13 | INDEX UNIQUE SCAN | I_FILE2 | 1 | 6 | | 0 (0)|
| 14 | NESTED LOOPS | | 98 | 6762 | | 1530 (54)|
| 15 | NESTED LOOPS | | 98 | 6174 | | 1530 (54)|
| 16 | HASH JOIN | | 169K| 3983K| 3920K| 840 (16)|
| 17 | TABLE ACCESS FULL | RECYCLEBIN$ | 174K| 1871K| | 585 (14)|
| 18 | TABLE ACCESS FULL | TS$ | 36 | 468 | | 11 (0)|
| 19 | FIXED TABLE FIXED INDEX | X$KTFBUE (ind:1) | 1 | 39 | | 0 (0)|
| 20 | INDEX UNIQUE SCAN | I_FILE2 | 1 | 6 | | 0 (0)|
| 21 | TABLE ACCESS BY INDEX ROWID| RECYCLEBIN$ | 1 | 11 | | 2 (0)|
| 22 | NESTED LOOPS | | 1 | 63 | | 17 (0)|
| 23 | NESTED LOOPS | | 1 | 52 | | 15 (0)|
| 24 | NESTED LOOPS | | 1 | 45 | | 14 (0)|
| 25 | TABLE ACCESS FULL | UET$ | 1 | 39 | | 14 (0)|
| 26 | INDEX UNIQUE SCAN | I_FILE2 | 1 | 6 | | 0 (0)|
| 27 | TABLE ACCESS CLUSTER | TS$ | 1 | 7 | | 1 (0)|
| 28 | INDEX UNIQUE SCAN | I_TS# | 1 | | | 0 (0)|
| 29 | INDEX RANGE SCAN | RECYCLEBIN$_TS | 7961 | | | 2 (0)|
------------------------------------------------------------------------------------------------

Statistics
----------------------------------------------------------
4027917 recursive calls
129 db block gets
891718 consistent gets
175114 physical reads
0 redo size
517 bytes sent via SQL*Net to client
469 bytes received via SQL*Net from client
2 SQL*Net roundtrips to/from client
0 sorts (memory)
0 sorts (disk)
1 rows processed

SQL> set autotrace off

Let's see what happen if we get rid off all that garbage... be pacient, it'll take 2 or 3 hours to purge the recycle bin.

SQL> purge dbarecycle_bin;

Recyclebin purged

Our timings will improve by the order of thousands, getting results in results in fractions of seconds. That will make easier and faster your space management tasks... say good bye to those long chats with your peers between tablespace resize (if you are using Enterprise Manager is even worse!).

SQL> run
1* select count(*) from all_objects where object_name like '%BIN%'

COUNT(*)
----------
103

Elapsed: 00:00:00.20

SQL> set linesize 255
SQL> set autotrace on explain statistics
SQL> run
1* select count(*) from dba_free_space

COUNT(*)
----------
1140

Elapsed: 00:00:00.06

Execution Plan
----------------------------------------------------------

------------------------------------------------------------------------------------------------
| Id | Operation | Name | Rows | Bytes |TempSpc| Cost (%CPU)|
------------------------------------------------------------------------------------------------
| 0 | SELECT STATEMENT | | 1 | | | 1563 (53)|
| 1 | SORT AGGREGATE | | 1 | | | |
| 2 | VIEW | DBA_FREE_SPACE | 190 | | | 1563 (53)|
| 3 | UNION-ALL | | | | | |
| 4 | NESTED LOOPS | | 1 | 39 | | 4 (0)|
| 5 | NESTED LOOPS | | 1 | 32 | | 3 (0)|
| 6 | TABLE ACCESS FULL | FET$ | 1 | 26 | | 3 (0)|
| 7 | INDEX UNIQUE SCAN | I_FILE2 | 1 | 6 | | 0 (0)|
| 8 | TABLE ACCESS CLUSTER | TS$ | 1 | 7 | | 1 (0)|
| 9 | NESTED LOOPS | | 90 | 4050 | | 12 (9)|
| 10 | NESTED LOOPS | | 90 | 3510 | | 12 (9)|
| 11 | TABLE ACCESS FULL | TS$ | 36 | 468 | | 11 (0)|
| 12 | FIXED TABLE FIXED INDEX | X$KTFBFE (ind:1) | 3 | 78 | | 0 (0)|
| 13 | INDEX UNIQUE SCAN | I_FILE2 | 1 | 6 | | 0 (0)|
| 14 | NESTED LOOPS | | 98 | 6762 | | 1530 (54)|
| 15 | NESTED LOOPS | | 98 | 6174 | | 1530 (54)|
| 16 | HASH JOIN | | 169K| 3983K| 3920K| 840 (16)|
| 17 | TABLE ACCESS FULL | RECYCLEBIN$ | 174K| 1871K| | 585 (14)|
| 18 | TABLE ACCESS FULL | TS$ | 36 | 468 | | 11 (0)|
| 19 | FIXED TABLE FIXED INDEX | X$KTFBUE (ind:1) | 1 | 39 | | 0 (0)|
| 20 | INDEX UNIQUE SCAN | I_FILE2 | 1 | 6 | | 0 (0)|
| 21 | TABLE ACCESS BY INDEX ROWID| RECYCLEBIN$ | 1 | 11 | | 2 (0)|
| 22 | NESTED LOOPS | | 1 | 63 | | 17 (0)|
| 23 | NESTED LOOPS | | 1 | 52 | | 15 (0)|
| 24 | NESTED LOOPS | | 1 | 45 | | 14 (0)|
| 25 | TABLE ACCESS FULL | UET$ | 1 | 39 | | 14 (0)|
| 26 | INDEX UNIQUE SCAN | I_FILE2 | 1 | 6 | | 0 (0)|
| 27 | TABLE ACCESS CLUSTER | TS$ | 1 | 7 | | 1 (0)|
| 28 | INDEX UNIQUE SCAN | I_TS# | 1 | | | 0 (0)|
| 29 | INDEX RANGE SCAN | RECYCLEBIN$_TS | 7961 | | | 2 (0)|
------------------------------------------------------------------------------------------------

Statistics
----------------------------------------------------------
295 recursive calls
129 db block gets
12437 consistent gets
0 physical reads
0 redo size
516 bytes sent via SQL*Net to client
469 bytes received via SQL*Net from client
2 SQL*Net roundtrips to/from client
0 sorts (memory)
0 sorts (disk)
1 rows processed


Please, before you go, don't forget to vote the poll regarding the content of this blog, thank you!

Your trash will drag you

If you think that Oracle recycle bin (feature available since 10g1) has no direct impact on your performance, you better think deep about it... seriously.

Try the following (if possible) : turn on statement timing, then issue a simple SELECT on DBA_FREE_SPACE and keep record of elapsed time; create a couple of hundreds of thousands tables in a 10g database, and then delete it (the DB recycle bin feature must be turned on) ... now you have a full-to-the-top recycle bin, then repeat the SELECT on DBA_FREE_SPACE, you'll see it will take a longer time to complete, and finally will get a huge number of rows. You may think that suddenly the free space has been multiplied... but your response time divided.

I don't know ... I'll let you think about this puzzling situation here and come back later to see how you doing.

Question: Can you figure out what is happening?

Subscribe to Oracle Database Disected by Email

Tuesday, March 25, 2008

2 minute guide for Statspack Installation

Ver este articulo en Español

Statspack is an Oracle database tool that is both powerful and underused, it's the first reporting resource you have (it's free, comes in the box) to see what is happening in your DB at a glance.

Ingredients
1 Oracle sql*plus session
1 Tablespace with at least 200Mb (9i) or 400Mb (10g) of free space*
1 user with DBA power

*Recommend you create a brand new tablespace

Preparation
You need to install Statspack previous to any use, then you have to run just one script... yes, it's that easy.
Login with your powerful user, then at the prompt type:

SQL> @?/rdbms/admin/spcreate

...you've started the Statspack setup, that will create the owner for the Statspack objects, which username is fixed to PERFSTAT. In order to acomplish that, asks for the tablespace where all objects will be stored, the temporary tablespace Statspack will use for sorting data and the user password.

You'll end with a message like this, and a result listing at the place you executed sqlplus.

It's recommended to establish a baseline for your reporting, then you must connect as PERFSTAT and take your first snapshot:
SQL> exec statspack.snap;

It will run with detail level 5, which is the default ... and enough for 90% of the cases. Taking samples 2 to 5 minutes apart is the period recommended, you may take samples with longer intervals but some results will get their formatting exceded and show # marks.
You may be interested on scheduling execution of statspack.snap, please read 2 minute guide for Statspack sampling

Further ... and detailed reading at the Oracle(R) Database Performance Tuning Guide.


Add to Technorati Favorites

Subscribe to Oracle Database Disected by Email

Friday, February 22, 2008

FOR UPDATE... or not FOR UPDATE, that is the question

Have you considered the impact of an unnecesary FOR UPDATE on your queries?

I had this database which suddenly rised the redo log generation rate, running on archive log mode (like every production database must be) it become a nightmare, trying to backup logs every hour or planning a huge space increase for the archive log destination filesystem.

Fortunately we keep track of every development that is promoted to production; our records showed that near the date a recent interface was released, the database increased the redo log activity. Then we proceeded to disect the suspicious code, realizing that the programmer coded 4 nested loops (on 4GL, given we have BaaN) and every loop was coded using, a presumably unnecesary SELECT...FOR UPDATE.

Those findings pointed the way of my research, since on a previous review of the process, every intermediate result table was turned to NOLOGGING, without any reduction on redo log creation, the only place where logging was taking place was the UNDO tablespace, a behavior that cannot be turned off. But I've to verify this theory... and find a solution to the puzzle.

I knew where to look for the information needed: the Oracle Data Dictionary views, then I opened the Oracle Database Reference for 10gR2, which is the 'fortunate' release of our test environment, given that our production is running 9R2, both under HP-Unix and showing exactly the same behavior.

These views helped to find useful information, and finally pinpoint the issue:
V$FILESTAT : if the UNDO tablespace was under heavy IO, it may be reflected here.
DBA_DATA_FILE : I needed to translate the file number to something meaningful.
V$UNDOSTAT : provided a 7 day meassure window that allowed to correlate heavy redo log generation with high UNDO activity.
V$EVENT_HISTOGRAM : histograms for every wait event.
V$SESSTAT : timed statistics by user session.
V$SYSSTAT : timed sytem statistics.
V$STATNAME : name of every statistic.

First I tried the following query and the resulting set confirmed the theory: at the very first place was located the datafiles for the UNDO tablespace.

 SELECT b.file_name, a.phywrts, a.phyblkwrt, a.writetim
FROM v$filestat a, dba_data_files b
WHERE a.file# = b.file_id
ORDER BY a.phyblkwrt DESC

Then I built this test case to confirm if there was a difference between SELECT and SELECT..FOR UPDATE shown at redo log write.

SQL> create table test ( col1 varchar2(10) );

Table created

SQL> select sid from v$mystat where rownum = 1;
1609

1 row returned
SQL> select name,a.value
2 from v$sesstat a, v$sysstat b
3 where b.statistic#=a.statistic#
4 and b.name = 'redo size' and sid = 1609;

redo size 13112
1 row selected

SQL> insert into test values ('World');

SQL> commit

SQL> select name,a.value
2 from v$sesstat a, v$sysstat b
3 where b.statistic#=a.statistic#
4 and b.name = 'redo size' and sid = 1609;

redo size 13504
1 row selected
SQL> select * from test;

SQL> select name,a.value
2 from v$sesstat a, v$sysstat b
3 where b.statistic#=a.statistic#
4 and b.name = 'redo size' and sid = 1609;

redo size 13504
1 row selected

SQL> select * from test for update;

redo size 14248
1 row selected

You may see that after issuing a simple SELECT there wasn't an effect in redo size, that effect was present modifying the query with the FOR UPDATE clause.

Explanation

Seems that SELECT...FOR UPDATE creates a copy of the information retrieved, which is stored at the UNDO tablespace. The undo tablespace logging behavior cannot be changed, therefore when the interface program was executed, there was m * n * p * q writes to the undo tablespace and therefore to the redo logs.

Results

After sending our recommendation to development to change their code and use simple SELECTs, the redo generation rate droped from 4 Gb to 500 Mb per hour, which is a considerable reduction.

Subscribe to Oracle Database Disected by Email

Sunday, October 28, 2007

OWI... wan-kenobi?

Sure you remember the Star Wars zaga ... and Obi-wan-kenobi as the first 'Force'-instructor of Luke. Well, my point here is how to use the Force with Oracle Server... with OWI or Oracle Wait Interface as its long name stands.

That is not an 'interface' in the way you pass values to the DB Kernel, instead you get information of waits generated in the system and wait events within the sessions... yes, prepare you laser-saber to fight all those annoying performance issues, your mind will broad his perception.

v$session_event (9i)
Lists all wait events for all sessions, with number of ocurrences and timing stats.

v$session_wait (9i)
Shows current wait event for sessions.

This is one of my favourite scripts that shows ans example of OWI usage. I've been using this script to analyze a performance issue with Peoplesoft: disk contention.


SELECT
a.sid,
a.osuser,
a.process,
substr(a.client_info,1,40) as "ClientInfo" ,
a.LOGON_TIME,
b."TimeWaited_Minutes",
((sysdate-LOGON_TIME)*24*60) as "Sess_TIME"
FROM v$session a,
(SELECT
sid,
total_waits,
TO_CHAR((time_waited/100)/60,'9,990.999') as "TimeWaited_Minutes"
FROM v$session_event c
WHERE c.EVENT = 'db file sequential read') b
WHERE username = '{PS owner username}'
AND status = 'ACTIVE'
AND a.SID = b.sid

v$event_histogram (10g)
Shows current instance histrograms for every wait event, organized on time interval buckets that progress following the formula 2^n milliseconds. For instance:

EVENT# EVENT WAIT_TIME_MILLI WAIT_COUNT
11 Log archive I/O 1 29069
11 Log archive I/O 2 115
11 Log archive I/O 4 211
11 Log archive I/O 8 391
11 Log archive I/O 16 140973
11 Log archive I/O 32 103846
11 Log archive I/O 64 21678
11 Log archive I/O 128 4953
11 Log archive I/O 256 822
11 Log archive I/O 512 31
It's important to mention that the initizialization parameter TIMED_STATISTICS must be set to TRUE, and statistics are lost (or reset) when the database is shutdown or started up.

v$eventmetric (10g)
With this view you'll be able to see the last 60 seconds of wait event metrics, which gives a more recent time frame than v$event_histogram. This is a small sample of its content.

BEGIN_TIME   END_TIME  INTSIZE_CSEC EVENT# EVENT_ID NUM_SESS_WAITING TIME_WAITED WAIT_COUNT
29/02/2008 11:49:48 a.m. 29/02/2008 11:50:47 a.m. 5960 0 2516578839 0 0 0
29/02/2008 11:49:48 a.m. 29/02/2008 11:50:47 a.m. 5960 1 3539483025 1 5564.8417 32
29/02/2008 11:49:48 a.m. 29/02/2008 11:50:47 a.m. 5960 2 3934444552 0 0 0
29/02/2008 11:49:48 a.m. 29/02/2008 11:50:47 a.m. 5960 3 866018717 10 50716.6575 9871
29/02/2008 11:49:48 a.m. 29/02/2008 11:50:47 a.m. 5960 4 3083157888 0 0 0
29/02/2008 11:49:48 a.m. 29/02/2008 11:50:47 a.m. 5960 5 2324796046 0 0 0

You'll get a more meaningful output if you use (or modify) the following script:

SELECT
b.NAME,
to_char(a.BEGIN_TIME,'DD-MON-YYYY') as BeginDay,
to_char(a.BEGIN_TIME,'HH24:MI:SS') as BeginTime,
to_char(a.END_TIME, 'HH24:MI:SS' ) as EndTime,
a.NUM_SESS_WAITING, a.TIME_WAITED, a.WAIT_COUNT
FROM v$eventmetric a, v$event_name b
WHERE a.EVENT_ID = b.EVENT_ID
ORDER BY time_waited DESC


Master these tables and you'll be invincible when fighting the Dark Side.

Subscribe to Oracle Database Disected by Email
Custom Search