Friday, October 31, 2008

Index Dynamics - Part 2 (Halloween on the Block)

Add to Technorati Favorites

Ver este artículo en Español

View starting post: Index Dynamics - Part 1

As I've promised, today will share with you mid-term results for my index observations.

First we may see a graph of Used Space, as reported by column PCT_USED of table INDEX_STATS (right after an ANALYZE over each index). This percentage accounts the space allocated to the B-Tree that is used.
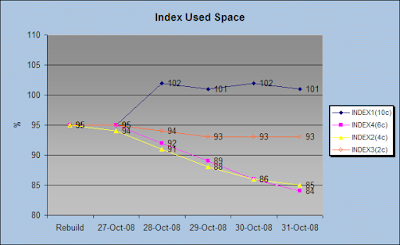
There is one line for every index we are considering, and note the legend on the graph showing the index name and the number of columns inside parenthesis.

What can be observed in this chart?
1) After rebuild (done on saturday), every index starts with 95% used space.
2) First day is sunday, the system had almost 0 activity, therefore our indexes' space usage show slight changes.
3) Starting on monday, INDEX1 reported wrong data for PCT_USED and the other indexes began their "decay" trend.
4) After a whole week of activity, indexes gained free space, some of them faster than others (for instance INDEX4 went from 95% to 84% used space, that is 11% on 5 days).

Point 3 raised a service request with Oracle.
Point 4 may be explained in terms of:
a) Table transactionality (how many insertions/deletes/updates it had)
b) Index type, if unique or non-unique.
c) Number of columns conforming the index.
d) Type of every indexed column.

I may propose the following hypothesis: the index used space decay rate is directly proportional to the table's transactionality, to the number of columns and types of them, and inversely proportional to the type of the index (Unique or non-Unique) and block size.

As you already know, B-Tree indexes have two types of nodes: called Branches and Leafs.

Now, let's see where is that space allocated, look this chart that shows increment or delta on daily samples taken from column LF_BLKS.

You may see a great saving due to rebuild, however that saving fades slowly during the following days. Next chart makes a zoom, in order to watch closely the variation rate experimented during those days.

Keep in mind the rate at which leaf blocks are incremented, later you'll see how it's related to new key insertions (transactionality).

What about the branches? ... that's what we're going to see on next chart: the behavior of those indexes for branch blocks. I've taken the sampled value for BR_BLKS and got the variation rate versus the previous day.

Please observe, the stepped peak for INDEX2 and INDEX4, during the first day of activity the number of branch blocks almost doubled, that means an intense reorganization within the index. That may be caused due to the nature of these indexes (all are UNIQUE) and a high transactionality rate.

For the INDEX3, we observe that the increase is splited between 2 days, Sunday and Monday. This table presented activity the day after the rebuild was done.

We have to ignore the INDEX4, cause their figures are not reliable.

Why is there a higher increase on the number of branch blocks? We may answer that question recalling the percentage of free space (5%) we had after the rebuild, that is a very small margin for a leaf block, and the chances of split increase if we have a UNIQUE index. We must remember that a leaf block split, may involve a branch block split.

Our partial conclusions may be stated as follow:
1) Depending on the percentage of free space, after rebuilding indexes, their state becomes "less" stable.
2) Indexes tend to take a "stable" form, with the pass of time.
3) The branch blocks are the stressed part of the B-Tree right after the rebuild.

I will finish this experiment next Saturday, and share with you all remaining findings next Tuesday; yes, seven days from now... or eight days? anyway...
I hope to get near a mathematical model for the Index Decay Rate, cross fingers.

Thank you for reading, keep in touch!

Follow to next post Index Dynamics - Part 3

Subscribe to Oracle Database Disected by Email

Follow IgnacioRuizMX on Twitter

Delicious
Bookmark this on Delicious

Tuesday, October 28, 2008

How to Flush your database caches

Add to Technorati Favorites

Ver este articulo en Español

Flushing the SGA memory areas, Shared Pool and Buffer Cache, it's an uncommon task, however, it gets useful when you're doing some tests and want to override the memory and go direct to disk, or when you have shared pool issues (here is a workaround, however I encourage you to find the root cause).

Shared Pool flush
This is the only sentence you have to know for releases 9i and up...
alter system flush shared_pool

Buffer Cache flush
For Oracle 9i I didn't know how to do this, fortunately found it today on Rahat Agivetova's blog
alter session set events = 'immediate trace name flush_cache';

I've tested it and does the job well...

And for Oracle 10g and up, the syntaxis is as follows:
alter system flush buffer_cache;

But you already knew that, isn't it? ...well, this was a "snack" post until Friday's follow up to Index Dynamics, which I may anticipate interesting results...

Thanks for reading... and for your comments, too!


You have UNDO space issues?: please read Who is using your UNDO space? Improved Script"
 
Subscribe to Oracle Database Disected by Email

Follow IgnacioRuizMX on Twitter

Delicious
Bookmark this on Delicious

Monday, October 27, 2008

Index dynamics

Add to Technorati Favorites

Sigue el link
Ver este articulo en Español


Today I will start with a series of 3 posts depicting the follow up of 4 index behavior on a Production database.

The purpose of this exercise is try to unveil the morphology these four indexes take during a given period of time, under what kind of load, model it in a graphical way. Since indexes are quite a black box, this exercises also proposes a complementary procedure for index quality measure.

Experiment subjects were selected using information on DBA_SEGMENTS+DBA_HIST_SEGMENTS, with focus on size and activity, indexes were choosen within the 400Mb-500Mb range thinking on fast ALTER INDEX REBUILD and fast ANALYZE VALIDATE STRUCTURE.

Our four candidates are (names were replaced in order to protect their identity)

OBJNAME BLOCKS BYTES HEIGHT PCTUSED
-------------------- ---------- ---------- ------ -------
INDEX1 62464 511705088 4 69
INDEX2 60416 494927872 4 53
INDEX3 61056 500170752 4 45
INDEX4 54272 444596224 4 63

We have our "Before" snapshots, now we need to rebuild all four indexes and take "Initial" snapshots to start the experiment. After this operation our figures are:

OBJNAME BLOCKS BYTES HEIGHT PCT_USED
-------------------- ---------- ---------- ------ --------
INDEX1 41600 340787200 4 95
INDEX2 34176 279969792 4 95
INDEX3 28032 229638144 3 95
INDEX4 37888 270445017 4 95

Note the amount of space "empty" the indexes had before rebuild, for INDEX2 and INDEX2 we may ask ourselves "How are the tables used in order to get index keys so dispersed?". INDEX1 and INDEX4 seem within normal parameters. All four indexes now have the same initial condition on 5% free space.

On October 31th, Friday ... Hallowen, we are going to see what has been happening with our indexes;and who knows, you may testify witchcraft... or, is it science? What do you think?

Keep in touch...

Jump to Part II Index Dynamics - Part 2

Subscribe to Oracle Database Disected by Email

Follow IgnacioRuizMX on Twitter

Delicious

Bookmark this on Delicious

Tuesday, October 21, 2008

Interview with a Pro: Dan Norris

Add to Technorati Favorites

Ver este articulo en Español

Today I will share with you a video interview, this section will be entitled: "Interview with a Pro", and it's aimed to all of you, IT professionals or not related to IT at all. We will present remarkable people, with notable activism for Oracle & IT, and high expertise level on their field.

This time, I'm glad to feature our interview with Dan Norris, he is a consultant (ESA Practice Manager actually) with Piocon, President of the Oracle RAC SIG, member of the Independent Oracle Users Group (IOUG) and a notable member of our IT community.

If you are unable to see this video on the embeded player (below), it's available from YouTube at this link Dan Norris Interview at Oracle Open World

I hope his knowledge and experiences would be useful for you.


Subscribe to Oracle Database Disected by Email

Monday, October 20, 2008

Statspack snapshot levels

Add to Technorati Favorites

You're going to start taking snapshots for Statspack reports, however do you really know what level will give you the detail you want? Valid values for snapshot level are 0,5,6,7 and 10, ordered from the less detailed to the most detailed.

Following are listed all the sections that may appear on a Statspack report and the snapshot level you need to run in order to get data for them. They are listed as their appearance order within the Statspack report. An 'X' mark means "present".

Snapshot Level

0 5 6 7 10
STATSPACK report for x x x x x
Load Profile x x x x x
Instance Efficiency Percentages
x x x x x
Top 5 Timed Events x x x x x
Wait Events for DB x x x x x
Background Wait Events for DB x x x x x
SQL ordered by Gets for DB
x x x x
SQL ordered by Reads for DB
x x x x
SQL ordered by Executions for DB
x x x x
SQL ordered by Parse Calls for DB
x x x x
SQL ordered by Sharable Memory for DB
x x x x
Instance Activity Stats for DB x x x x x
Tablespace IO Stats for DB x x x x x
File IO Stats for DB x x x x x
Buffer Pool Statistics for DB x x x x x
Instance Recovery Stats for DB x x x x x
Buffer Pool Advisory for DB x x x x x
Buffer wait Statistics for DB


x x
PGA Aggr Target Stats for DB x x x x x
PGA Aggr Target Histogram for DB x x x x x
PGA Memory Advisory for DB x x x x x
Enqueue activity for DB


x
Rollback Segment Stats for DB x x x x x
Rollback Segment Storage for DB x x x x x
Undo Segment Summary for DB
x x x x
Undo Segment Stats for DB
x x x x
Latch Activity for DB x x x x x
Latch Sleep breakdown for DB x x x x x
Latch Miss Sources for DB x x x x x
Parent Latch Statistics DB


x
Child Latch Statistics DB


x
Top 5 Logical Reads per Segment for DB


x x
Top 5 Physical Reads per Segment for DB


x x
Top 5 Buf. Busy Waits per Segment for DB


x x
Top 5 Row Lock Waits per Segment for DB


x
Top 5 ITL Waits per Segment for DB


x
Dictionary Cache Stats for DB x x x x x
Library Cache Activity for DB x x x x x
Shared Pool Advisory for DB x x x x x
SGA Memory Summary for DB x x x x x
SGA breakdown difference for DB x x x x x
Resource Limit Stats for DB x x x x x
init.ora Parameters for DB x x x x x

Now that you have decided which level are you going to use, you may read this article 2 minute guide to Statspack sampling, to start taking snaphots for your reports.

In case you want to know how to install Statspack quickly, read this 2 minute guide to Statspack installation.

Subscribe to Oracle Database Disected by Email

Follow IgnacioRuizMX on Twitter
Custom Search